Fears raised that new developments may have been priced too highly
|
Putney flat prices have reached yet new all-time highs according to the latest figures but there are growing concerns about the level of the market and looming supply.
According to the Land Registry figures for the third quarter, the average price of a home in the SW15 post code area is £718,626. This is below the all-time high seen at the end of last year but the headline figure is masking the underlying strength of the market because the proportion of flats being sold compared to houses is high. The average flat price is now well over half a million.
Taken in isolation the prices of flats sold are at a record high and the average terraced house is now worth just shy of a million,.
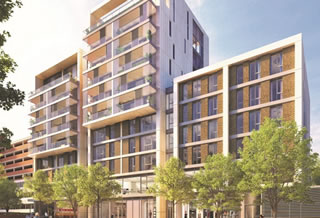
New build flats coming on to the market in the next few months could drive the average price up further. For example, Tileman House, (artist's impression below) on the Upper Richmond Road, where there are 56 units in the development and at the moment the developer is marketing them with prices starting at just under £700,000.
Similarly the 25 flats for sale in the Carlton Gate development are being marketed at prices starting at £765,000, and the Putney Rise development with 125 1-3 bedroom flats is also being sold at the moment with prices advertised from £599,950. There remains a question mark as to whether their is sufficient buyer interest in these kind of properties at such levels with some agents predicting that they might be difficult to shift.
The overall average peaked in the second quarter of 2014 but this was driven up by a surge in sales of very high priced properties probably caused by the anticipation of stamp duty changes
Although activity for top end properties in Putney has been muted since the stamp duty changes in the last budget there has been a number of high priced transaction. A seven bedroom property on St. Simon's Avenue changed hands for £4.450,000 making it the most expensive sale during the period.
 The September figures from the Land Registry’s Market Trend Data survey show that London remains the country’s best performing area in terms of residential property price rises. The average price in the capital is now just short of half a million at £499,997 up by 9.6% over the last year. The average property value in England and Wales rose by 5.3%to £186,553. Monthly house prices up 1.0 per cent since August 2015.
The number of completed house sales in England and Wales decreased by 4% to 81,696 compared with 84,691 in July 2014. The number of properties sold in England and Wales for over £1 million in July 2015 decreased by 9% to 1,413 from 1,555 a year earlier. Repossessions in England and Wales decreased by 50 per cent to 471 compared with 943 in July 2014 with only 36 taking place in London during the month.
In October, 25% more chartered surveyors in London saw house prices rise according to the latest RICS UK Residential Market Survey, compared to a balance of 26% more in September, showing a steady increase month-on-month.
However, only 5% more chartered surveyors are expecting a rise in prices in the capital over the next three months – this is the lowest reading across the UK over this time period. Despite this, the twelve month view for the capital is still relatively strong with 53% more respondents expecting prices to increase.
Demand from potential buyers grew modestly across London in October with 7% more respondents seeing a rise in new buyer enquiries. Demand continues to considerably outpace supply and the number of new instructions decreased for the ninth month in succession, with 9% more chartered surveyors reporting a fall, contributing to the rise in prices in the capital. The supply of new listings to the UK market as a whole has been in decline since the start of the 2015 with a decrease in new instructions in London every month this year.
In the London lettings market, demand increased at broadly similar pace to that of supply in the three months to October, as new landlord instructions rose at the quickest quarterly pace since early 2014. Nevertheless, rental expectations remain strong and respondents continue to expect rents to rise over the year ahead. Rental growth in the London is anticipated to accelerate to an average of around 4.5% per year over the coming five years.
Simon Rubinsohn, RICS Chief Economist, commented:
“It is hard to get away from the issue of supply when it comes to the current state of the housing market. The legacy of the drop in new build following the onset of the global financial crisis is now really hitting home with both the sales and letting markets continuing to show demand outstripping supply on a month by month basis. And if the five year projections from members regarding the outlook for both prices and rents is anything to go by, property is set to become even more unaffordable going forward making the governments focus of boosting to delivery of new homes absolutely critical.”
Changes to the tax regime have also had an impact in the top end of the market with the turnover of larger family houses in the area falling.
Adrian Gill, director of Reeds Rains and Your Move estate agents, said, “The Chancellor’s intimidating Stamp Duty remodel is still spooking the top end of the London market. Properties worth over £1.5 million have been hit with a stamp duty increase, currently set at 12% of the portion of the property’s value above £1.5m, up from 5% previously. As a result, sales of homes worth more than £1.5 million have fallen by 35% in Q3, compared to a year ago. This tax has really put the shackles on the prime market in the capital, as three quarters of these sales since January 2014 took place in London. “
| Putney Property Prices (July - September 2015) | ||||||||||
|---|---|---|---|---|---|---|---|---|---|---|
| Area | Detached | Sales | Semi-detached | Sales | Terrace | Sales | Flat/ mais |
Sales | Overall Ave | Overall Sales |
| SW15 1 | 843000 | 1 | 1535000 | 2 | 1289167 | 18 | 605227 | 22 | 940302 | 43 |
| SW15 2 | 0 | 0 | 0 | 0 | 1107797 | 15 | 592524 | 63 | 691615 | 78 |
| SW15 3 | 1098750 | 4 | 1975000 | 1 | 482500 | 2 | 561290 | 41 | 632248 | 48 |
| SW15 4 | 0 | 0 | 0 | 0 | 566667 | 3 | 317253 | 19 | 351264 | 22 |
| SW15 5 | 2725000 | 2 | 1077500 | 2 | 611582 | 11 | 423493 | 15 | 689493 | 30 |
| SW15 6 | 3500000 | 2 | 1704333 | 3 | 930600 | 5 | 532774 | 21 | 901750 | 31 |
| Total | 1965333 | 9 | 1539125 | 8 | 997544 | 54 | 537157 | 181 | 718626 | 252 |
| Last quarter | -10.7% | 12.5% | 12.2% | -33.3% | 12.4% | 8.0% | 2.8% | 21.5% | 0.7% | 15.1% |
| Last year | -15.4% | -10.0% | 10.1% | -33.3% | -0.8% | 0.0% | 8.4% | -10.0% | 2.7% | -9.0% |
| Last three years | -26.8% | 200.0% | 30.3% | -46.7% | 29.5% | 8.0% | 45.2% | 34.1% | 27.7% | 24.1% |
| Last five years | 9.7% | 28.6% | 31.0% | -68.0% | 53.7% | -11.5% | 57.5% | 17.5% | 32.5% | 2.0% |
| Last ten years | 51.3% | -47.1% | 113.5% | -80.5% | 124.0% | -20.6% | 115.5% | -12.6% | 79.2% | -24.3% |
Copyright
notice: All figures in this article are based on data released by the
Land Registry. The numbers are derived from analysis performed by PutneySW15.com.
Any use of these numbers should jointly attribute the Land Registry and
PutneySW15.com.
November 20, 2015