Agent attributes this to changes in mortgage & stamp duty criteria
|

Sales of property in SW15 have bounced back from an exceptionally slow start to the year but the number of transactions are still low by historic standards with only 219 properties sold in the second quarter of this year.
The average home in Putney now costs £713,825 down 10.7% on the same period last year. The extent of the fall probably has more to do with the collapse in the number of transactions at the very top end of the market than a generalised fall in prices.
Local agent Allan Fuller told PutneySW15,"We have a very different market to this time last year. 2104 up to about August saw a meteoric rise in property prices particularly in London. The assumption was that interest rates would rise by the end of the year, and everyone wanted to get in quick to get a good rate from lenders. In fact the bank rate is still at 0.5% now, so that fear was in fact unfounded."
He continued, "By the summer we found that buyers were resisting ever increasing prices and there was a noticeable slowdown in activity for the latter part of the year. Then the beginning of 2015 was overshadowed by the election. The result brought confidence back to property, but there are factors that has meant that generally prices are more stable especially in London."
Flats continue to be the best performing sector, and although prices have fallen slightly (-1.9%) since reaching record highs earlier in the year, the price of a flat still averages over half a million at £522,733.
Allan explains that the low levels are the combined result of three factors: "Firstly the very strictly lending criteria imposed on lenders has considerably reduced mortgage availability for many buyers."
"Secondly the changes in stamp duty have hit the top end of the market. Buying at £2.5 million means a tax of £213,750.
"The third reason is the most relevant, despite what the media generally say property is like any other commodity, prices will increase, but if buying activity slows then prices will have to level off. A perfect example of supply and demand creating prices."
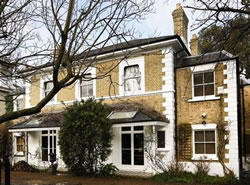 The most expensive home reported as sold to the Land Registry so far this year was ‘The Captain’s House’ on the Upper Richmond Road (pictured right) which went for just under £3,000,000. This is the 69th most expensive sale ever in the SW15 post code area which shows how relatively quiet the top end of the market is at the moment.
Allan informed us that, the local understanding that these houses were built for Nelson's Captains is actually an urban myth, apparently this was an idea thought up by a negotiator who worked for him nearly 30 years ago and has stuck ever since!
June data from the Land Registry showed that the average house price in London increased by 9.2% over the same period in 2014. This brings the average to £481,820. For England and Wales as a whole the average price rose by 5.4% to an new all-time high of £181,619. The previous record was in November 2007 before the financial crisis.
The number of completed house sales in England & Wales during April 2015 decreased by 19% to 57,180 compared with 70,244 in April 2014 and the number of properties sold in England and Wales for over £1 million decreased by 22%to 874 from 1,114 a year earlier. There were only 41 repossessions in London in April - half of the level seen a year ago.
| Putney Property Prices (April - June 2015) | ||||||||||
|---|---|---|---|---|---|---|---|---|---|---|
| Area | Detached | Sales | Semi-detached | Sales | Terrace | Sales | Flat/ mais |
Sales | Overall Ave | Overall Sales |
| SW15 1 | 0 | 0 | 1631667 | 3 | 1360833 | 12 | 651139 | 18 | 998348 | 33 |
| SW15 2 | 2300000 | 1 | 1415000 | 2 | 902125 | 8 | 578912 | 44 | 687620 | 55 |
| SW15 3 | 798000 | 2 | 1024000 | 5 | 692857 | 7 | 520278 | 36 | 605920 | 50 |
| SW15 4 | 0 | 0 | 0 | 0 | 0 | 0 | 226207 | 14 | 226207 | 14 |
| SW15 5 | 3150000 | 1 | 0 | 0 | 636373 | 20 | 463606 | 16 | 629599 | 37 |
| SW15 6 | 2642488 | 4 | 1807500 | 2 | 1080000 | 3 | 541902 | 21 | 960163 | 30 |
| Total | 2201994 | 8 | 1371667 | 12 | 887289 | 50 | 522733 | 149 | 713825 | 219 |
| Last quarter | 49.6% | 60.0% | 29.9% | 100.0% | -9.3% | 78.6% | -1.9% | 35.5% | 6.7% | 47.0% |
| Last year | -24.9% | -63.6% | -0.7% | -45.5% | -9.1% | 0.0% | 4.6% | -35.8% | -10.3% | -32.8% |
| Last three years | 0.5% | 166.7% | 45.0% | 20.0% | 17.2% | 8.7% | 30.3% | 16.4% | 30.6% | 17.1% |
| Last five years | -6.2% | 100.0% | 16.6% | 20.0% | 40.1% | 13.6% | 43.7% | 16.4% | 38.9% | 17.7% |
| Last ten years | 129.9% | 0.0% | 59.0% | -53.8% | 86.9% | -20.6% | 99.8% | -19.9% | 85.9% | -22.6% |
Copyright
notice: All figures in this article are based on data released by the
Land Registry. The numbers are derived from analysis performed by PutneySW15.com.
Any use of these numbers should jointly attribute the Land Registry and
PutneySW15.com.
August 13, 2015