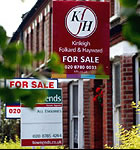
March sales indicate increased turnover in home market
|
 March saw a noticeable increase in property sales in the SW15 area compared to the very fallow winter months.
The average price of a home sold in the first quarter is up by 12.2%, however a closer look at the figures suggest a two tier market is developing. There is renewed volume at the top end of the market with transactions of detached properties appearing in the figures for the first time in several quarters. Prices of terraced houses have also rallied although it should be pointed out that only 15 changed hands in the period under review.
On the other hand flat prices are down by 8.8% so far this year having held up relatively well previously.
The average Putney property cost £434,198 over the first three months of this year which is slightly above the same period last year. The overall average is likely to be distorted by the renewed activity in higher priced properties and it is likely that most local homes have fallen in value over that period.
Volumes continue to be poor with turnover at about three quarters of what it had been three years ago.
The Land Registry data for March for the country as a whole shows an annual house price change of -16.2%. This brings price levels back to those seen in August 2004.
London prices have fallen by 15.4 % to £299,613. Prices did rise slightly in March, the first time in a year the price index has seen a positive change.
Properties Sold in SW15 -March 2009
| Address | Price (£) | Deed Date |
| Flat 1, 2, Schubert Road, SW15 2QS | 422,500 |
31/03/2009 |
| 8, Abbotstone Road, SW15 1QR | 910,000 |
27/03/2009 |
| 52, Parkstead Road, SW15 5AP | 249,950 |
27/03/2009 |
| 86, Crestway, SW15 5DD | 299,000 |
27/03/2009 |
| Flat 10, Hill Court, Putney Hill, SW15 6BB | 155,000 |
27/03/2009 |
| Flat 25, Westmark Point, Norley Vale, SW15 4BX | 125,000 |
25/03/2009 |
| 12, Laneway, SW15 5HX | 280,000 |
25/03/2009 |
| 27, 1 Queen Marys House, Holford Way, SW15 5DH | 410,000 |
25/03/2009 |
| 25, Carmalt Gardens, SW15 6NE | 1,165,000 |
25/03/2009 |
| Flat 8, Bonner House, Aubyn Square, SW15 5NR | 175,000 |
23/03/2009 |
| Flat 11, Henry Jackson House, Henry Jackson Road, SW15 1DL | 262,000 |
20/03/2009 |
| 27, Kingsclere Close, SW15 4EY | 225,500 |
20/03/2009 |
| 18, Elmshaw Road, SW15 5EL | 265,000 |
20/03/2009 |
| 241, Clarence Lane, SW15 5PZ | 200,000 |
20/03/2009 |
| 94, 1 Queen Marys House, Holford Way, SW15 5DU | 458,250 |
20/03/2009 |
| 12, Larpent Avenue, SW15 6UP | 1,268,750 |
18/03/2009 |
| 42, Bowness Crescent, SW15 3QL | 250,000 |
17/03/2009 |
| Ground Floor Flat, 77, Disraeli Road, SW15 2DR | 386,000 |
13/03/2009 |
| 11, Chepstow Close, SW15 2HG | 426,500 |
13/03/2009 |
| Flat 5, 66, Upper Richmond Road, SW15 2RP | 380,000 |
13/03/2009 |
| Flat 7, 100, Friars Avenue, SW15 3DU | 132,500 |
12/03/2009 |
| 73, 1 Queen Marys House, Holford Way, SW15 5DU | 415,000 |
11/03/2009 |
| Flat 103, 25 Putney Wharf, Brewhouse Lane, SW15 2JX | 1,835,000 |
09/03/2009 |
| Flat 7, 401 Roehampton Wick, Upper Richmond Road, SW15 5QW | 300,000 |
06/03/2009 |
| 26, 1 Queen Marys House, Holford Way, SW15 5DH | 350,000 |
06/03/2009 |
| Flat 54, Hill Court, Putney Hill, SW15 6BB | 275,000 |
06/03/2009 |
| Flat 12, 42 Paramount Apartments, Putney Hill, SW15 6AQ | 450,000 |
06/03/2009 |
| Flat 11, 35, Keswick Road, SW15 2EW | 480,000 |
04/03/2009 |
| 44, Robin Hood Lane, SW15 3PY | 700,000 |
02/03/2009 |
Copyright notice: All figures in this article are based on data released by the Land Registry. The numbers are derived from analysis performed by PutneySW15.com. Any use of these numbers should jointly attribute the Land Registry and PutneySW15.com.
April 26, 2009