Agent says election could pose 'French banker' risk for larger properties
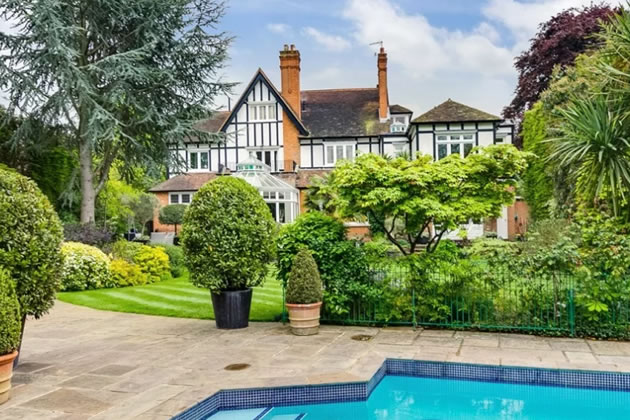 Heathview Gardens house selling for over £7,000,000
The looming general election and Brexit uncertainty is not putting everybody off investing in property in the SW15 area.
Recently the second highest price ever was paid for a house in Putney with £7,500,000 changing hands for a home on Heathview Gardens. It was on this road that the highest price of £8,200,000 was registered for Putney although the record for SW15 remains the £15 million transacted for a property on Priory Lane, Roehampton.
This was not the only sale to take place in the multi-million pound price bracket according to the latest data released by the Land Registry.
One local estate agent said, “The scarcity effect is working for large family houses in Putney particularly at prestige addresses. They aren’t building more of these and demand is growing. The main risk for this asset type is not really Brexit but the election of a government pledged to aggressively tax people on high incomes. Many French bankers came to live in this part of the world because of punitive taxation under the Francois Hollande government but now Macron wants them back and there would be a lot of stock coming on to the market. They would be particularly sensitive to the election of a government led by Corbyn and McDonnell but the polls are suggesting there may be no need for them to panic.”
Overall the price of the average home sold in SW15 rose by 3.9% to £815,379 in the third quarter compared with a year ago. While prices of houses generally seem to have performed well with the average terrace property remaining over £1,000,000, flat prices continue to struggle down by 7.3% compared to last year.
On the other hand, there appears to have been a recovery from the exceptionally low levels of transactions for flats seen earlier in the year. New developments such as the Bowery Building are seeing steady if not brisk sales with 8 units reported as being taken up so far in the third quarter.

The Land Registry House Price Index for August 2019 shows that overall prices were down by 1.4% in London which made it the worse performing area in the UK. For the country as a whole the average price rose by 1.3% to £234,853.
The Royal Institution of Chartered Surveyors’ (RICS) August 2019 UK Residential Market Survey reported a flat trend in demand (new buyer enquiries) at the national level, following a few months in which enquiries had increased modestly. Newly agreed sales moved slightly further into negative territory. Alongside this, new instructions to sell were broadly unchanged for the third successive report.
The Bank of England’s Agents‘ summary of business conditions – 2019 Q3 reported that the housing market continued to soften, reflecting deteriorating supply and demand. Estate agents reported softer demand in the secondary market, though demand for lower-priced properties was more resilient.
The UK Property Transactions Statistics for August 2019 showed that on a seasonally adjusted basis, the estimated number of transactions on residential properties with a value of £40,000 or greater was 99,890. This is 0.9% higher than a year ago. Between July 2019 and August 2019, transactions increased by 15.8%.
The Bank of England’s Money and Credit release reported that mortgage approvals for house purchase (an indicator of future lending) decreased in August 2019 to 65,500. This is down from the previous peak seen in July 2019 of 67,000 but remained within the narrow range seen over the past 3 years.
| Putney Property Prices (July - September 2019) | ||||||||||
|---|---|---|---|---|---|---|---|---|---|---|
Area |
Detached |
Sales |
Semi-detached |
Sales |
Terrace |
Sales |
Flat/ mais |
Sales |
Overall Ave |
Overall Sales |
| SW15 1 | 1480000 | 1 | 1610000 | 2 | 1276917 | 18 | 693110 | 14 | 1068230 | 35 |
| SW15 2 | 2815000 | 2 | 2090000 | 1 | 1008714 | 7 | 529356 | 28 | 779026 | 38 |
| SW15 3 | 3237000 | 3 | 745000 | 1 | 445000 | 3 | 353375 | 12 | 843763 | 19 |
| SW15 4 | 0 | 0 | 0 | 0 | 405000 | 2 | 285450 | 10 | 305375 | 12 |
| SW15 5 | 0 | 0 | 775500 | 2 | 658000 | 5 | 478000 | 4 | 613909 | 11 |
| SW15 6 | 3302500 | 2 | 1760000 | 1 | 1500000 | 3 | 467920 | 22 | 827116 | 28 |
| Total | 2928250 | 8 | 1338000 | 7 | 1052118 | 38 | 486964 | 90 | 815379 | 143 |
| Last quarter | 57.5% | 100.0% | 14.1% | -41.7% | 3.3% | 5.6% | -6.1% | 11.1% | 8.2% | 7.5% |
| Last year | 10.2% | -20.0% | -14.7% | -41.7% | 22.1% | -17.4% | -7.3% | -26.2% | 3.9% | -24.7% |
| Last three years | -19.3% | -33.3% | -14.2% | 0.0% | 0.7% | -24.0% | -17.6% | -49.7% | -4.8% | -42.3% |
| Last five years | 26.1% | -20.0% | -4.3% | -41.7% | 4.6% | -29.6% | -1.7% | -55.2% | 16.5% | -48.4% |
| Last ten years | 55.1% | 14.3% | 43.3% | -41.7% | 95.0% | -29.6% | 57.7% | -26.2% | 74.3% | -26.7% |
Copyright notice: All figures in this article are based on data released by the Land Registry. The numbers are derived from analysis performed by PutneySW15.com. Any use of these numbers should jointly attribute the Land Registry and PutneySW15.com.
November 8, 2019
![]()