Agents look to stamp duty changes to revive lower priced end of market
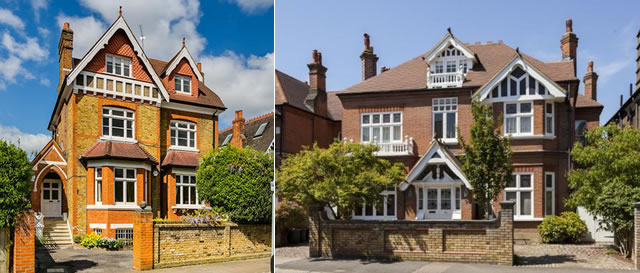
Two properties sold on Egliston Road for over £3million pounds
|
The property market in SW15 remains in the doldrums with prices stuck in the same range for the last three years but there does seem to be one area where activity is high – homes selling for over £3million.
Other types of homes seeing historically low levels of turnover buying interest for large family homes seems as strong as ever with four of the 132 properties reported as sold in the third quarter going for £3million or above. They included two detached houses on Egliston Road and semis on Atney Road and Dover Park Drive.
Local agent Allan Fuller commented, "Four high price sales do not an Autumn property market make. They do however reinforce the attractiveness of living in Putney, Erpingham Road has some lovely houses, but it also has a major attraction in being spot on for the catchment area schools particularly Our Lady of Victories.”
Others have speculated that larger houses in the area are still seeing good levels of activity because there are willing sellers as well as willing buyers with the possibility raised that French and other EU workers in the city are moving back to the continent after Brexit.
Over the last year prices in the SW15 post code area covering Putney and Roehampton have fallen by 6.7% but this is largely because a few exceptionally high priced sales went through in the same period in 2016 including a house on Priory Lane sold for £15,000,000 and one on Roehampton Gate changing hands for £6,820,000..
Allan said, "It is far more likely, that property prices will remain fairly stable, seeing more first time buyers coming into the market can only be healthy, we always have been a society that wants to own our own homes and any help and encouragement to achieve that has to be a good thing.”
He added that the budget was very interesting due to the moves made by the Chancellor to encourage house building and home ownership. Stamp duty land tax (SDLT) was abolished for all first-time buyer purchases up to £300,000 with immediate effect. It has also been removed on the first £300,000 of properties bought for up to £500,000 – good news for those looking to get on to the property ladder in high price areas like London. In the third quarter of this year 78 sales in SW15 were for under £500,000 and would potentially have been partly exempt from stamp duty. This relief will not be available where the cost of the property exceeds £500,000. In those circumstances, standard SDLT rates will still apply to the full purchase price.
Allan adds, “I would not like to take all of the credit, but I did write to the Chancellor a few weeks ago suggesting taking stamp duty away from first time buyers up to £500,000, I can understand that the bar has been set lower. There is an argument that this change could push up prices by increasing demand. I don’t see that, it is far more likely to encourage home ownership it is almost as irrelevant an argument as saying some help to buy schemes push up prices."

According to the Nationwide House Price Index prices in London were down for the first time in eight years in September. It was the weakest performing region in the country with prices down by 0.6% year on year. Overall prices in the UK were up by 2.0% over the same period.
Robert Gardner, Nationwide's Chief Economist, said, “The annual rate of house price growth remained broadly stable in September at 2.0%, compared with 2.1% in August. Housing market activity, as measured by the number of housing transactions and mortgage approvals, has strengthened a little in recent months, though remains relatively subdued by historic standards.
“Low mortgage rates and healthy rates of employment growth are providing some support for demand, but this is being partly offset by pressure on household incomes, which appear to be weighing on confidence. The lack of homes on the market is providing ongoing support to prices.”
The direction of price movement is confirmed by the Royal Institution of Chartered Surveyors (RICS) which is also saying that prices are declining in London.
The latest report from the RICS report on says that the number of buyers and sellers is falling and sees the short-term outlook for prices as continuing to be poor. Most surveyors are predicting lower prices over the next three months.
They also believe the rise in base rates this month will also depress the market with around four million mortgage seeing a rise in interest rates as a result of the Bank of England's decision to increase rates by 0.25% to 0.5%.
Simon Rubinsohn, RICS' chief economist said, "The combination of the increased cost of moving, a lack of fresh stock coming to the market, uncertainly over the political climate and now an interest rate hike appears to be taking its toll on activity in the housing market.
"A stagnant second-hand market is bad news for the wider economy, not just in terms of spending, but also because it restricts mobility."
| Putney Property Prices (June to September 2017) | ||||||||||
|---|---|---|---|---|---|---|---|---|---|---|
| Area | Detached | Sales | Semi-detached | Sales | Terrace | Sales | Flat/ mais |
Sales | Overall Ave | Overall Sales |
| SW15 1 | 3000000 | 1 | 1900000 | 1 | 1389167 | 12 | 649667 | 18 | 1039500 | 32 |
| SW15 2 | 0 | 0 | 3200000 | 1 | 1241250 | 4 | 585997 | 18 | 813607 | 23 |
| SW15 3 | 0 | 0 | 1250000 | 1 | 624000 | 4 | 472191 | 17 | 535148 | 22 |
| SW15 4 | 0 | 0 | 0 | 0 | 732500 | 2 | 308244 | 8 | 393095 | 10 |
| SW15 5 | 2700000 | 3 | 1025000 | 2 | 723750 | 10 | 379114 | 11 | 829144 | 26 |
| SW15 6 | 2450000 | 2 | 1520000 | 2 | 782667 | 3 | 496625 | 12 | 855132 | 19 |
| Total | 2666667 | 6 | 1634286 | 7 | 1005186 | 35 | 510296 | 84 | 799139 | 132 |
| Last quarter | 10.1% | -14.3% | 47.4% | -61.1% | 10.2% | -27.1% | -0.1% | -30.6% | 8.8% | -32.0% |
| Last year | -26.5% | -50.0% | 4.8% | 0.0% | -3.8% | -30.0% | -13.6% | -53.1% | -6.7% | -46.8% |
| Last three years | 14.8% | -40.0% | 16.9% | -41.7% | -0.1% | -35.2% | 3.0% | -58.2% | 14.2% | -52.3% |
| Last five years | -0.6% | 100.0% | 38.3% | -53.3% | 30.5% | -30.0% | 37.9% | -37.8% | 42.0% | -35.0% |
| Last ten years | 40.3% | -60.0% | 64.7% | -74.1% | 45.1% | -56.3% | 62.1% | -68.7% | 59.7% | -66.2% |
Copyright notice: All figures in this article are based on data released by the Land Registry. The numbers are derived from analysis performed by PutneySW15.com. Any use of these numbers should jointly attribute the Land Registry and PutneySW15.com.
November 23, 2017
![]()