House in Roehampton sold after vote becomes area's third highest priced
Property on Roehampton Lane becomes third most expensive home ever in SW15
|
Property prices in SW15 appear to be unaffected by the vote to leave the EU with the latest data showing them to be at record levels. Recent sales include a house in Roehampton changing hands for the third highest price ever in the area. However, this rise has been reached at a time when the number of transactions are at historically low levels.
The latest figures from the Land Registry show the average sale price in the SW15 post code area during the third quarter of 2016 to be £839,388 up 18.7% on the same period last year.
The number of sales reported in the third quarter is about half the level that was seen in the same period last year and is down even from the previous quarter which was depressed by changes in Stamp Duty rates and anxiety about Brexit.
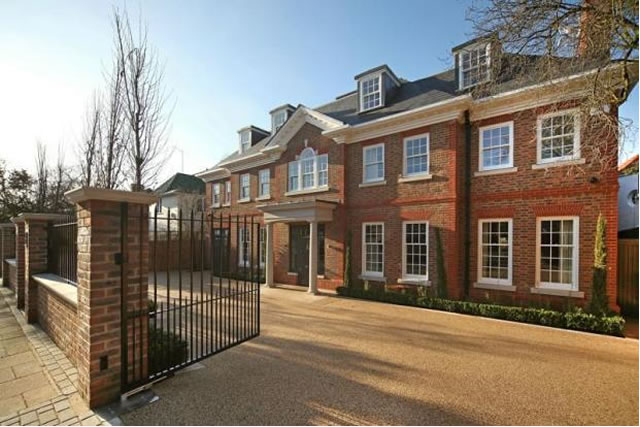
The most expensive of these was a detached six bedroom house house near Roehampton Gate which was sold in August for £6,820,000. It was last sold in August 2009 when it exchanged hands for £1,650,000 an 313% increase in value over seven years.
Flat prices have bucked the trend seeing a fall in the latest figures but it is not clear if this is because of the mix of flats being sold. The majority of these sales were still in the SW15 2 post code sector which includes the modern riverside developments east of Putney High Street.
Local agent Allan Fuller commented, "There is no doubt that there have been factors influencing the market generally. Brexit has created uncertainty. The City of London is a major worldwide financial hub. The effect that coming out of the EU will have on it is still far from clear. Certainly is it creating job uncertainty and therefore those who think there is a possibility of them being affected will not have the idea of buying property uppermost in their plans".
 Alan added , "There may be plenty of people in this country who have a hatred of banks and the financial institutions, however they are a vital part of our economy now that manufacturing is such a small area of the economy, so in effect we all benefit from the jobs and tax revenue that is generated in London. So this combined with the hike in stamp duty from the 4th December 2015 for properties over £937,000 has considerably slowed activity. This may seem to be just affecting the wealthy. However what it has meant is that higher priced property is slower and harder to sell and in many instances has had to be reduced to sell. So often people are not selling and the normal flow of people moving up and down the property ladder has ceased. This has a knock on effect across the board".
Finishing with a word of warning, "There is much lobbying of the new Chancellor to lower stamp duty to invigorate property and make rates more fair, the Autumn Statement is due next week to watch out, my view is that taxes don’t often come down so don’t hope for too much".
The Land Registry’s House Price Index is showing that the average price of a home sold in London in August was £488,908 which is up 12.1% over the same month last year. For the UK as a whole the index shows and average price of £218,964 up by 8.4% compared to the previous year.
The short term indications for the market appear to be positive. Mortgage approvals for house purchases rose to a three-month high in September according to the Bank of England, and RICS, the surveyors’ industry group, have reported that buyer inquiries were the highest since February. They say this indicates that market activity is recovering after a quieter period earlier in the year due to uncertainty over the referendum.
If your agent is claiming to be marketing your property effectively and it doesn't appear on PutneySW15.com it may be time to choose a new agent.
The numbers below are subject to revision as is it usual that some properties are added late to the Land Registry's database.
| Putney Property Prices (July - September 2016) | ||||||||||
|---|---|---|---|---|---|---|---|---|---|---|
| Area | Detached | Sales | Semi-detached | Sales | Terrace | Sales | Flat/ mais |
Sales | Overall Ave | Overall Sales |
| SW15 1 | 0 | 0 | 2150000 | 1 | 1291111 | 9 | 603107 | 14 | 925562 | 24 |
| SW15 2 | 1747333 | 3 | 0 | 0 | 1050333 | 9 | 542391 | 28 | 747049 | 40 |
| SW15 3 | 1452500 | 2 | 982500 | 2 | 1215000 | 1 | 520417 | 15 | 694562 | 20 |
| SW15 4 | 0 | 0 | 0 | 0 | 0 | 0 | 270625 | 4 | 270625 | 4 |
| SW15 5 | 6820000 | 1 | 2056000 | 1 | 739091 | 11 | 465319 | 13 | 886737 | 26 |
| SW15 6 | 3088333 | 3 | 2540000 | 1 | 1110417 | 6 | 492635 | 13 | 1081380 | 23 |
| Total | 2692444 | 9 | 1742200 | 5 | 1030014 | 36 | 516926 | 87 | 839388 | 137 |
| Last quarter | 46.2% | 50.0% | 43.9% | -37.5% | 23.4% | 44.0% | -15.6% | -32.6% | 16.9% | -18.5% |
| Last year | 37.0% | 0.0% | 13.2% | -37.5% | 2.4% | -36.8% | -2.8% | -56.3% | 18.7% | -49.8% |
| Last three years | 29.8% | -35.7% | 30.9% | -77.3% | 22.0% | -57.6% | 17.3% | -55.6% | 22.9% | -56.8% |
| Last five years | 31.7% | -40.0% | 58.2% | -79.2% | 54.2% | -41.9% | 40.6% | -53.0% | 44.2% | -52.1% |
| Last ten years | 71.5% | -66.7% | 170.9% | -78.3% | 84.0% | -51.4% | 57.4% | -72.4% | 82.4% | -68.8% |
Copyright
notice: All figures in this article are based on data released by the
Land Registry. The numbers are derived from analysis performed by PutneySW15.com.
Any use of these numbers should jointly attribute the Land Registry and
PutneySW15.com.
February 23, 2017
![]()