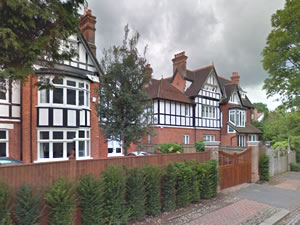
House in Heathview Gardens becomes SW15's second most expensive
|
Putney property prices finished 2014 strongly ending the year up by 21.2%
The latest figures from the Land Registry for the SW15 post code area show that the average sale price in the last quarter of the year £766,315, the second highest three month average on record.
Unlike many other areas of London where stamp duty changes appear to have dampened interest in higher priced properties, locally there was good demand at the top end of the market and this masked a dip in the prices of flats and terrace houses.
The period saw the second highest price for a residential property in the area with a house in Heathview Gardens selling for £7,450,000. The all-time high was set earlier this year when a home in the same street changed hands for £8,200,000.
One concern for local agents will be the decline in the amount of sales in the area. There were nearly 30% fewer transactions than in the same period last year.

Local agent Allan Fuller commented: "A reported growth in property prices of 21.2% is a staggering amount, especially as this mainly occurred in the first half of the year. It certainly illustrates how popular our area is! It is also a reflection of the improving economy and availability of mortgage finance. There was a frantic period of activity in the first part of 2014 as people were desperately chasing property and competitive bidding was commonplace. This happens when there is a sudden boom and to a large degree it is prices catching up to where they would have been if there had been steady growth in previous years.
He continued: "The market became much calmer from August, prices had reached a natural peak by then and we were finding buyers saying that they would not pay over the odds, frankly this was a good thing as otherwise we would have seen prices dropping if they had just gone on rising, but to a large degree having reached a peak property values have levelled out and then remained static for the rest of the year. The central London market has seen a slow down because of the stamp duty changes, all the talk of Mansion Tax, and changes to tax rules for non-residents. However most property in Putney at the higher ranges are bought by locals who are not affected in this way, and the political parties calling for mansion tax seem to be diluting their proposals in view of the negative press it is getting, even from many in their own parties!"
"What we have now is a much calmer market, fewer transactions is probably because some are waiting because of the election, this is fairly normal, but usually we find once it is over whatever the outcome people get on with life plans anyway and so those that might be holding off then take action. Our view is that by the end of 2015 there will have been growth in prices but to on the scale of last year. One certainty is that our town will be as popular as ever!"
London continues to be the area of the country seeing the strongest price growth. During December the average price in the capital was £464,936 up another 1.8% compared to the previous month to bring the annual price rise to 16.8%
The December data shows a monthly price increase of 0.6 % bringing the annual price change to 7.0% and the average house price in England and Wales to £177,766.
The number of property transactions has increased over the last year. From July 2013 to October 2013 there was an average of 75,201 sales per month compared to 82,067 for the same period in 2014.
Simon Rubinsohn, RICS Chief Economist, said, 'Despite the slowdown, there is optimism that the stamp duty reforms will deliver a 2-5% boost in both sales and prices over the next 12 months, despite members in London expecting sales to decrease by between 5-10% and prices to decrease by 2-5%, with larger properties and/or those in prime areas expected to see the biggest price decreases.'
| Putney Property Prices (October - December 2014) | ||||||||||
|---|---|---|---|---|---|---|---|---|---|---|
| Area | Detached | Sales | Semi-detached | Sales | Terrace | Sales | Flat/ mais |
Sales | Overall Ave | Overall Sales |
| SW15 1 | 4625000 | 1 | 2462500 | 2 | 1434104 | 14 | 597209 | 28 | 1029984 | 45 |
| SW15 2 | 3250000 | 1 | 1830000 | 3 | 1076813 | 8 | 547811 | 32 | 792828 | 44 |
| SW15 3 | 2709988 | 4 | 545000 | 1 | 737500 | 4 | 438432 | 37 | 664281 | 46 |
| SW15 4 | 0 | 0 | 0 | 0 | 468500 | 2 | 191400 | 7 | 252978 | 9 |
| SW15 5 | 3103333 | 3 | 728333 | 3 | 683885 | 17 | 402085 | 17 | 748912 | 40 |
| SW15 6 | 2800000 | 2 | 2337782 | 3 | 988250 | 4 | 449029 | 40 | 704643 | 49 |
| Total | 3056814 | 11 | 1679862 | 12 | 982816 | 49 | 475840 | 161 | 766315 | 233 |
| Last quarter | 31.6% | 10.0% | 20.2% | 0.0% | -2.3% | -9.3% | -4.0% | -19.9% | 9.5% | -15.9% |
| Last year | 51.3% | -35.3% | 53.4% | -25.0% | 21.2% | -35.5% | 10.4% | -27.5% | 21.2% | -29.6% |
| Last three years | 86.7% | 175.0% | 53.6% | 140.0% | 46.1% | 6.5% | 22.1% | -17.9% | 61.2% | -7.2% |
| Last five years | 129.6% | 10.0% | 16.2% | 71.4% | 45.8% | 0.0% | 46.3% | 11.8% | 55.8% | 11.0% |
| Last ten years | 466.1% | 266.7% | 145.9% | -47.8% | 126.1% | -7.5% | 93.1% | -30.0% | 144.0% | -24.6% |
Not sure which areas are covered by the postcodes? Click here for details.
Copyright
notice: All figures in this article are based on data released by the
Land Registry. The numbers are derived from analysis performed by PutneySW15.com.
Any use of these numbers should jointly attribute the Land Registry and
PutneySW15.com.
May 5, 2015