Boom times for estate agents as prices and volumes surge
|

A sharp rise in property transactions in recent months has home values in SW15 surge to a new all-time high. The average price in the area has risen to £682,868 in the third quarter of 2013, up by 21.4% compared to the same period last year.
Over 300 properties were sold from July to September, the highest level of turnover for six years and more than 50% up on the level seen in 2012.
The rise in the average price has been boosted by a change in the mix of properties sold locally with houses changing hands more rapidly than flats. Terraced house prices in the area are up by just 7.6%
The most expensive sold during the period was in Heathview Gardens, costing its new owners £4,200,000 to become the seventh most expensive home in SW15.
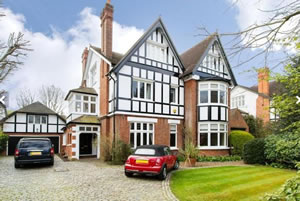
Heathview Gardens
 Kate Cooper, Sales Director at Allan Fuller commented:
"
The newest figures released and the exceptional surge in the average prices achieved in the Putney area this year are testament of the frenetic market we’ve enjoyed throughout the year. Never before have we experienced property demand so wild, we’ve frequently found that properties are sold within a week of marketing commencing, and often with multiple offers made resulting in best and final bids for the vast majority of our instructions this year – the perfect seller’s market."
She continued: " More confidence in the longer term strength of the market from families as well as buy to let investors, who have returned to the market with force, is continuing to bulk up demand across the market. First time buyers are finding competition from not only each other but also investors. Across the board the injection of cash buyers and buy to let investors has weakened the reliability on affordability relating to earnings which continues to allow property prices to climb, making the lack of supply ever more critical as less cash rich buyers are being forced out of the market in favour of stronger buyers with higher affordability."
"Turnover due to the critical lack of supply is still much lower, almost 50% less across England and Wales, than what we were experiencing in 2007 but slowly this continues to improve." said Kate. "The lending recovery since 2008 has been relatively slow but mortgage funding continues to ease as the recession fades and the base rate level has been an enormous boost for everyone. Looking forward, the degree of confidence that the recent market has given us will continue into next year and beyond when we expect the values in the area to continue rising. Inevitably with the ever looming base rate increase due in the next 2 – 3 years and the elections of 2015, value increases at the level we are currently experiencing may be unsustainable, and a more comfortable increase over the next few years may be more realistic."
The September data from Land Registry's House Price Index shows that London remains the best performing property market in England and Wales. The average price of a home in the capital rose by 9.3% over the year to £393,462.
Jon Pishiri, RICS London residential spokesperson commented, “Increasing demand and continuing low supply are major determinants in London prices being pushed up. The Help to Buy initiative coupled with rising rental values are further encouraging people to purchase a house as opposed to renting. There is an obvious need to increase supply to the market in order to address this problem.”
For the country as a whole prices rose by 3.4% which takes the average property value in England and Wales to £167,063. Repossession volumes decreased by 28 per cent in July 2013 to 1,187 compared with 1,645 in July 2012.
The number of properties sold in England and Wales for over £1 million in July 2013 increased by 34 per cent to 1,143 from 852 in July 2012.
| Putney Property Prices (July - September 2013) | ||||||||||
|---|---|---|---|---|---|---|---|---|---|---|
| Area | Detached | Sales | Semi-Det | Sales | Terrace | Sales | Flat/ Mais |
Sales | Total Ave | Total Sales |
| SW15 1 | 840000 | 1 | 1941069 | 4 | 1143856 | 20 | 536563 | 28 | 877456 | 53 |
| SW15 2 | 1255000 | 1 | 1247500 | 6 | 869275 | 20 | 509370 | 44 | 683631 | 71 |
| SW15 3 | 2236667 | 3 | 663000 | 4 | 518738 | 4 | 417128 | 47 | 535206 | 58 |
| SW15 4 | 1172500 | 2 | 0 | 0 | 512000 | 3 | 182382 | 17 | 317341 | 22 |
| SW15 5 | 2525000 | 3 | 1012500 | 2 | 655718 | 31 | 420770 | 20 | 684690 | 56 |
| SW15 6 | 2576250 | 4 | 1560417 | 6 | 1083714 | 7 | 445165 | 40 | 790528 | 57 |
| Total | 2073571 | 14 | 1331308 | 22 | 844551 | 85 | 440631 | 196 | 682868 | 317 |
| Last quarter | -16.3% | 180.0% | -7.3% | 100.0% | 7.4% | 63.5% | 12.3% | 24.1% | 17.7% | 40.3% |
| Last year | -22.7% | 366.7% | 12.7% | 46.7% | 9.7% | 70.0% | 19.1% | 45.2% | 21.4% | 56.2% |
| Last three years | 15.7% | 100.0% | 13.3% | -12.0% | 30.1% | 39.3% | 29.2% | 27.3% | 25.9% | 28.3% |
| Last five years | 38.7% | 366.7% | 30.8% | 175.0% | 13.1% | 183.3% | 18.5% | 94.1% | 33.6% | 123.2% |
| Last ten years | 40.5% | 75.0% | 123.9% | 37.5% | 106.6% | -7.6% | 90.6% | -33.3% | 120.6% | -22.7% |
Copyright notice: All figures in this article are based on data released by the Land Registry. The numbers are derived from analysis performed by PutneySW15.com. Any use of these numbers should jointly attribute the Land Registry and PutneySW15.com.
January 15, 2014