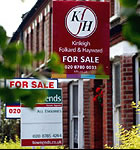
Average price up 4.4% compared with the same period last year
|
Putney property prices have risen according to the latest numbers from the Land Registry, and appear to be returning towards the all time high seen in third quarter of 2010.
Sales of terraced houses were particularly strong, up by 32.2% although this may have something to do with areas in which these properties were sold - those in the SW15 2 area average over £1m.
The mix of sales may have understated the rise in market. As the volume of sale of flats were up by 20% in last quarter which will be driving down the average price overall.
Prices are up by 28.1% over 5 years and 102.6% over 10 years but the volume of transactions are at less than half the levels they were at this time.
The June data from Land Registry's flagship House Price Index shows an annual price decrease of -2.5 per cent which takes the average property value in England and Wales to £161,479. The monthly change from May to June is 0.0 per cent.
London is the only region in England and Wales to have experienced an increase in its average property value over the last 12 months with a movement of 0.8%. Over the same period property prices in the North East were down by 7.1%. This brings the average price in London to £339,480 compare to £161,479 in England and Wales as a whole.
Putney Property Prices (April - June 2011)
| Area | Detached | Sales | Semi-Det | Sales | Terraced | Sales | Flat/ Mais |
Sales | Total Ave. | Total Sales |
|---|---|---|---|---|---|---|---|---|---|---|
| SW15 1 | 0 | 0 | 0 | 0 | 945646 | 23 | 455650 | 15 | 752227 | 38 |
| SW15 2 | 0 | 0 | 0 | 0 | 1136431 | 8 | 410194 | 36 | 542237 | 44 |
| SW15 3 | 0 | 0 | 433333 | 3 | 0 | 0 | 343554 | 24 | 353529 | 27 |
| SW15 4 | 0 | 0 | 0 | 0 | 285666 | 3 | 157000 | 4 | 212143 | 7 |
| SW15 5 | 0 | 0 | 0 | 0 | 348050 | 5 | 330211 | 22 | 333515 | 27 |
| SW15 6 | 1870833 | 3 | 1943333 | 3 | 642500 | 4 | 353120 | 24 | 661393 | 34 |
| Total | 1870833 | 3 | 1188333 | 6 | 837408 | 43 | 369716 | 125 | 536529 | 177 |
| Last quarter | 14.3% | -50.0% | 14.3% | -40.0% | 31.5% | -12.2% | 12.3% | 20.2% | 5.8% | 4.7% |
| Last year | -20.3% | -25.0% | 1.0% | -40.0% | 32.2% | -2.3% | 1.6% | -2.3% | 4.4% | -4.8% |
| Last three years | 43.7% | 0.0% | -26.9% | 0.0% | 16.5% | 2.4% | 3.4% | 2.5% | 6.1% | 2.3% |
| Last five years | 18.5% | -70.0% | 33.1% | -76.9% | 60.7% | -40.3% | 44.9% | -34.6% | 28.1% | -40.8% |
| Last ten years | 48.2% | -57.1% | 159.1% | -77.8% | 133.7% | -50.6% | 94.3% | -54.2% | 102.6% | -55.1% |
Copyright notice: All figures in this article are based on data released by the Land Registry. The numbers are derived from analysis performed by PutneySW15.com. Any use of these numbers should jointly attribute the Land Registry and PutneySW15.com.
October 10, 2011
