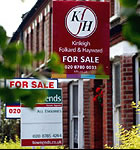
Astonishing figures show market at record high
 The latest official figures from the Land Registry are showing that Putney property prices appear to have bucked the national trend and started to rise again.
After two successive weak quarters prices bounced back in the latest period to a new all-time high level ignoring the credit crunch and prices falling elsewhere in London and the rest of the UK. The average SW15 home cost £505,658 between April and June of this year.
We have asked local agents for an explanation but so far none have been able to come up with one for the price turnaround which seems to have taken them by surprise. One explanation could be that many properties bought in Putney tend to be purchased by people who already live in the area and therefore have a lot of existing equity. Over the last five years a terraced house in SW15 is up by 68.3% and a flat has increase in value by 57.5%
The news is not all good for agents with volumes half those seen in the same period last year although the number of sales is up on the last quarter.
There is a temptation to dismiss the numbers as a statistical aberration but the average is based on 173 transactions during the quarter. The headline figure has been boosted by more transactions at the top end of the market but not by much. So far 10 properties have been recorded as changing hands for over £1,000,000 in the quarter, the same number as for January to March. With the sub sectors of the market also moving up the rise appears to be broad based.
The average house price in England and Wales stands at £180,781 in June, which is a decrease from last month. House prices in these two countries have fallen for ten consecutive months.
The average property price in London is currently £345,136, which is up 2.5% over the last year although the level has been falling for the last 5 months.
The numbers are subject to revision as usually some properties are added late to the Land Registry's database.
Putney Property Prices - April to June 2008
| Area | Detached | Sales | Semi-Det | Sales | Terrace | Sales | Flat/ Mais |
Sales | Total Ave. | Total Sales |
|---|---|---|---|---|---|---|---|---|---|---|
| SW15 1 | 0 | 0 | 0 | 0 | 832322 | 20 | 367944 | 18 | 612353 | 38 |
| SW15 2 | 0 | 0 | 0 | 0 | 823363 | 11 | 436792 | 35 | 529233 | 46 |
| SW15 3 | 0 | 0 | 0 | 0 | 412666 | 3 | 367100 | 20 | 373043 | 23 |
| SW15 4 | 0 | 0 | 0 | 0 | 0 | 0 | 202543 | 17 | 202543 | 17 |
| SW15 5 | 0 | 0 | 0 | 0 | 369000 | 5 | 303000 | 4 | 339667 | 9 |
| SW15 6 | 1301666 | 3 | 1625000 | 6 | 469500 | 3 | 347180 | 28 | 619613 | 40 |
| Total | 1301666 | 3 | 1625000 | 6 | 718927 | 42 | 357615 | 122 | 505658 | 173 |
| Last quarter | 221.0% | -14.3% | 12.7% | 10.5% | 4.9% | 4.3% | 21.0% | 6.8% | ||
| Last year | -42.9% | -80.0% | 84.0% | -75.0% | 15.5% | -22.2% | 3.9% | -55.6% | 1.3% | -53.0% |
| Last 3 years | 35.9% | -62.5% | 88.3% | -76.9% | 51.4% | -33.3% | 36.7% | -34.4% | 31.7% | -38.9% |
| Last 5 years | 105.0% | -50.0% | 68.3% | -28.8% | 57.5% | -44.8% | 73.9% | -40.8% |
Copyright notice: All figures in this article are based on data released by the Land Registry. The numbers are derived from analysis performed by PutneySW15.com. Any use of these numbers should jointly attribute the Land Registry and PutneySW15.com.
August 22, 2008