High Tides on the Thames at Putney
Times of extra flooding risk for Putney Embankment
|
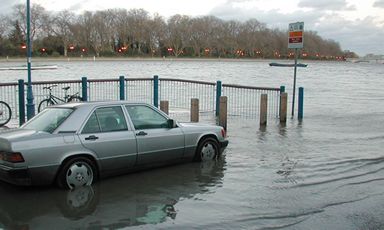
There are several places in London where the Thames regularly floods riverside roads or paths. One of these is the Embankment in Putney, upstream from Putney Bridge, where any tide of about 7 metres or more (height measured at London Bridge) will result in parts of the road being flooded, usually between 2.00 and 6.00, both a.m. and p.m.
The table below lists all the dates for this year on which the high tide is predicted to be 7.2 metres or more.
The table contains predictions and is meant as a guide only. Some flooding may occur on other dates, tides can peak earlier or later than the predicted times, and actual tide heights will be affected by the weather (recent rainfall, atmospheric pressure and wind strength and direction). Hence no warranty is provided, and we cannot accept any responsibility for accident, damage or injury caused through the use of the tide tables.
| Exceptionally High Tides at Putney Bridge | ||
|---|---|---|
| Date | Height | Time |
| 18/04/2011 | 7.3 | 3:29 PM |
| 19/04/2011 | 7.3 | 3:43 AM |
| 19/04/2011 | 7.4 | 4:12 PM |
| 20/04/2011 | 7.3 | 4:26 AM |
| 20/04/2011 | 7.3 | 4:54 PM |
| 21/04/2011 | 7.3 | 5:09 AM |
| 19/05/2011 | 7.2 | 4:08 AM |
| 20/05/2011 | 7.2 | 4:53 AM |
| 01/08/2011 | 7.2 | 4:15 AM |
| 02/08/2011 | 7.3 | 4:59 AM |
| 02/08/2011 | 7.2 | 5:13 PM |
| 03/08/2011 | 7.3 | 5:41 AM |
| 03/08/2011 | 7.2 | 5:51 PM |
| 04/08/2011 | 7.2 | 6:23 AM |
| 29/08/2011 | 7.2 | 3:08 AM |
| 30/08/2011 | 7.4 | 3:55 AM |
| 30/08/2011 | 7.3 | 4:11 PM |
| 31/08/2011 | 7.5 | 4:38 AM |
| 31/08/2011 | 7.3 | 4:51 AM |
| 01/09/2011 | 7.5 | 5:20 AM |
| 01/09/2011 | 7.3 | 5:29 PM |
| 02/09/2011 | 7.3 | 6:00 AM |
| 02/09/2011 | 7.2 | 6:08 PM |
| 27/09/2011 | 7.3 | 2:42 AM |
| 27/09/2011 | 7.2 | 3:00 AM |
| 28/09/2011 | 7.4 | 3:29 AM |
| 28/09/2011 | 7.3 | 3:43 PM |
| 29/09/2011 | 7.5 | 4:12 AM |
| 29/09/2011 | 7.4 | 4:25 PM |
| 30/09/2011 | 7.5 | 4:54 AM |
| 30/09/2011 | 7.4 | 5:06 PM |
| 01/10/2011 | 7.3 | 5:34 AM |
| 01/10/2011 | 7.3 | 5:47 PM |
| 26/10/2011 | 7.2 | 2:13 AM |
| 27/10/2011 | 7.4 | 3:01 AM |
| 27/10/2011 | 7.3 | 3:17 PM |
| 28/10/2011 | 7.4 | 3:46 AM |
| 28/10/2011 | 7.4 | 4:01 PM |
| 29/10/2011 | 7.4 | 4:29 AM |
| 29/10/2011 | 7.4 | 4:45 PM |
| 30/10/2011 | 7.2 | 4:11 AM |
| 30/10/2011 | 7.2 | 4:30 PM |
| 26/11/2011 | 7.2 | 2:24 AM |
| 26/11/2011 | 7.2 | 2:43 PM |
| 27/11/2011 | 7.2 | 3:09 AM |
| 27/11/2011 | 7.3 | 3:30 PM |
| 28/11/2011 | 7.2 | 4:16 PM |
The times in the table are calculated for Putney Bridge. All times are local (GMT or BST according to the season). The tide heights are the predictions for London Bridge.
The numbers are based on the tables published on the Port of London Authority site and adjusted and republished with permission.
April 18, 2011